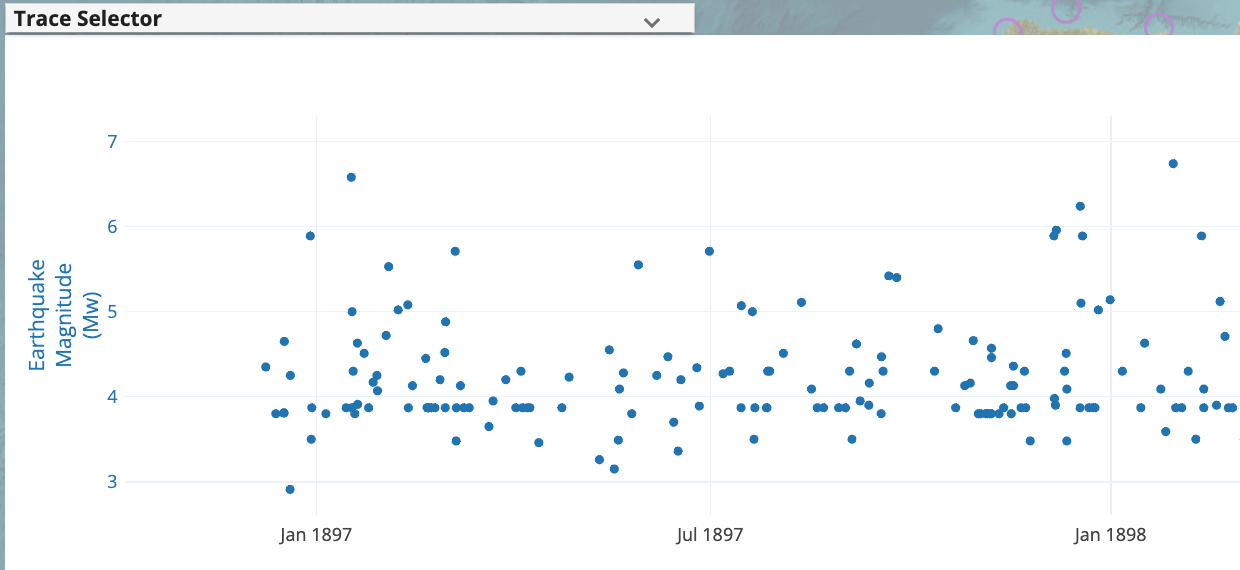
Scatter Plot
The EPOS GUI supports displaying time series as scatter plots, enhancing the visualization of your data:
Usage
To correctly display a CoverageJSON as a Scatter Plot, follow these steps:
-
Add the
plotTypeAttribute to the Desired Parameter:- In your CoverageJSON payload, locate the
parametersobject. - For the parameter you wish to visualize as a scatter plot, add the
plotTypeattribute.
Example:
{
  "parameters": {
    "Magnitude": {
      "description": {
        "en": "The magnitude of the earthquake"
      },
      "observedProperty": {
        "id": "earthquake_magnitude",
        "label": {
          "en": "Earthquake Magnitude"
        }
      },
      "plotType": "https://www.data-to-viz.com/graph/scatter.html", // Add this
      "type": "Parameter",
      "unit": {
        "symbol": "Mw"
      }
    }
  }
} - In your CoverageJSON payload, locate the
-
Define Supported Plot Types:
- Currently, the EPOS GUI supports two plot types:
-
Scatter Plot: Identified using
https://www.data-to-viz.com/graph/scatter.html -
Line Plot: Identified using
https://www.data-to-viz.com/graph/line.html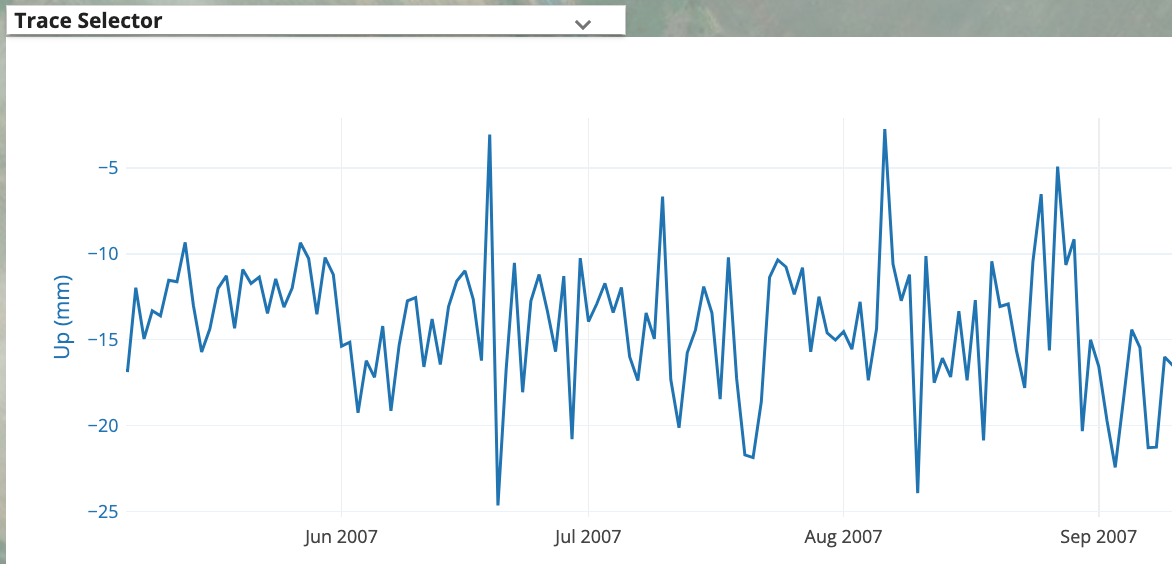
-
- Currently, the EPOS GUI supports two plot types:
Default Plot Type
If the plotType attribute is not explicitly specified for a parameter within the parameters object, the EPOS GUI will default to displaying the parameter using a Line Plot.