Error Bars
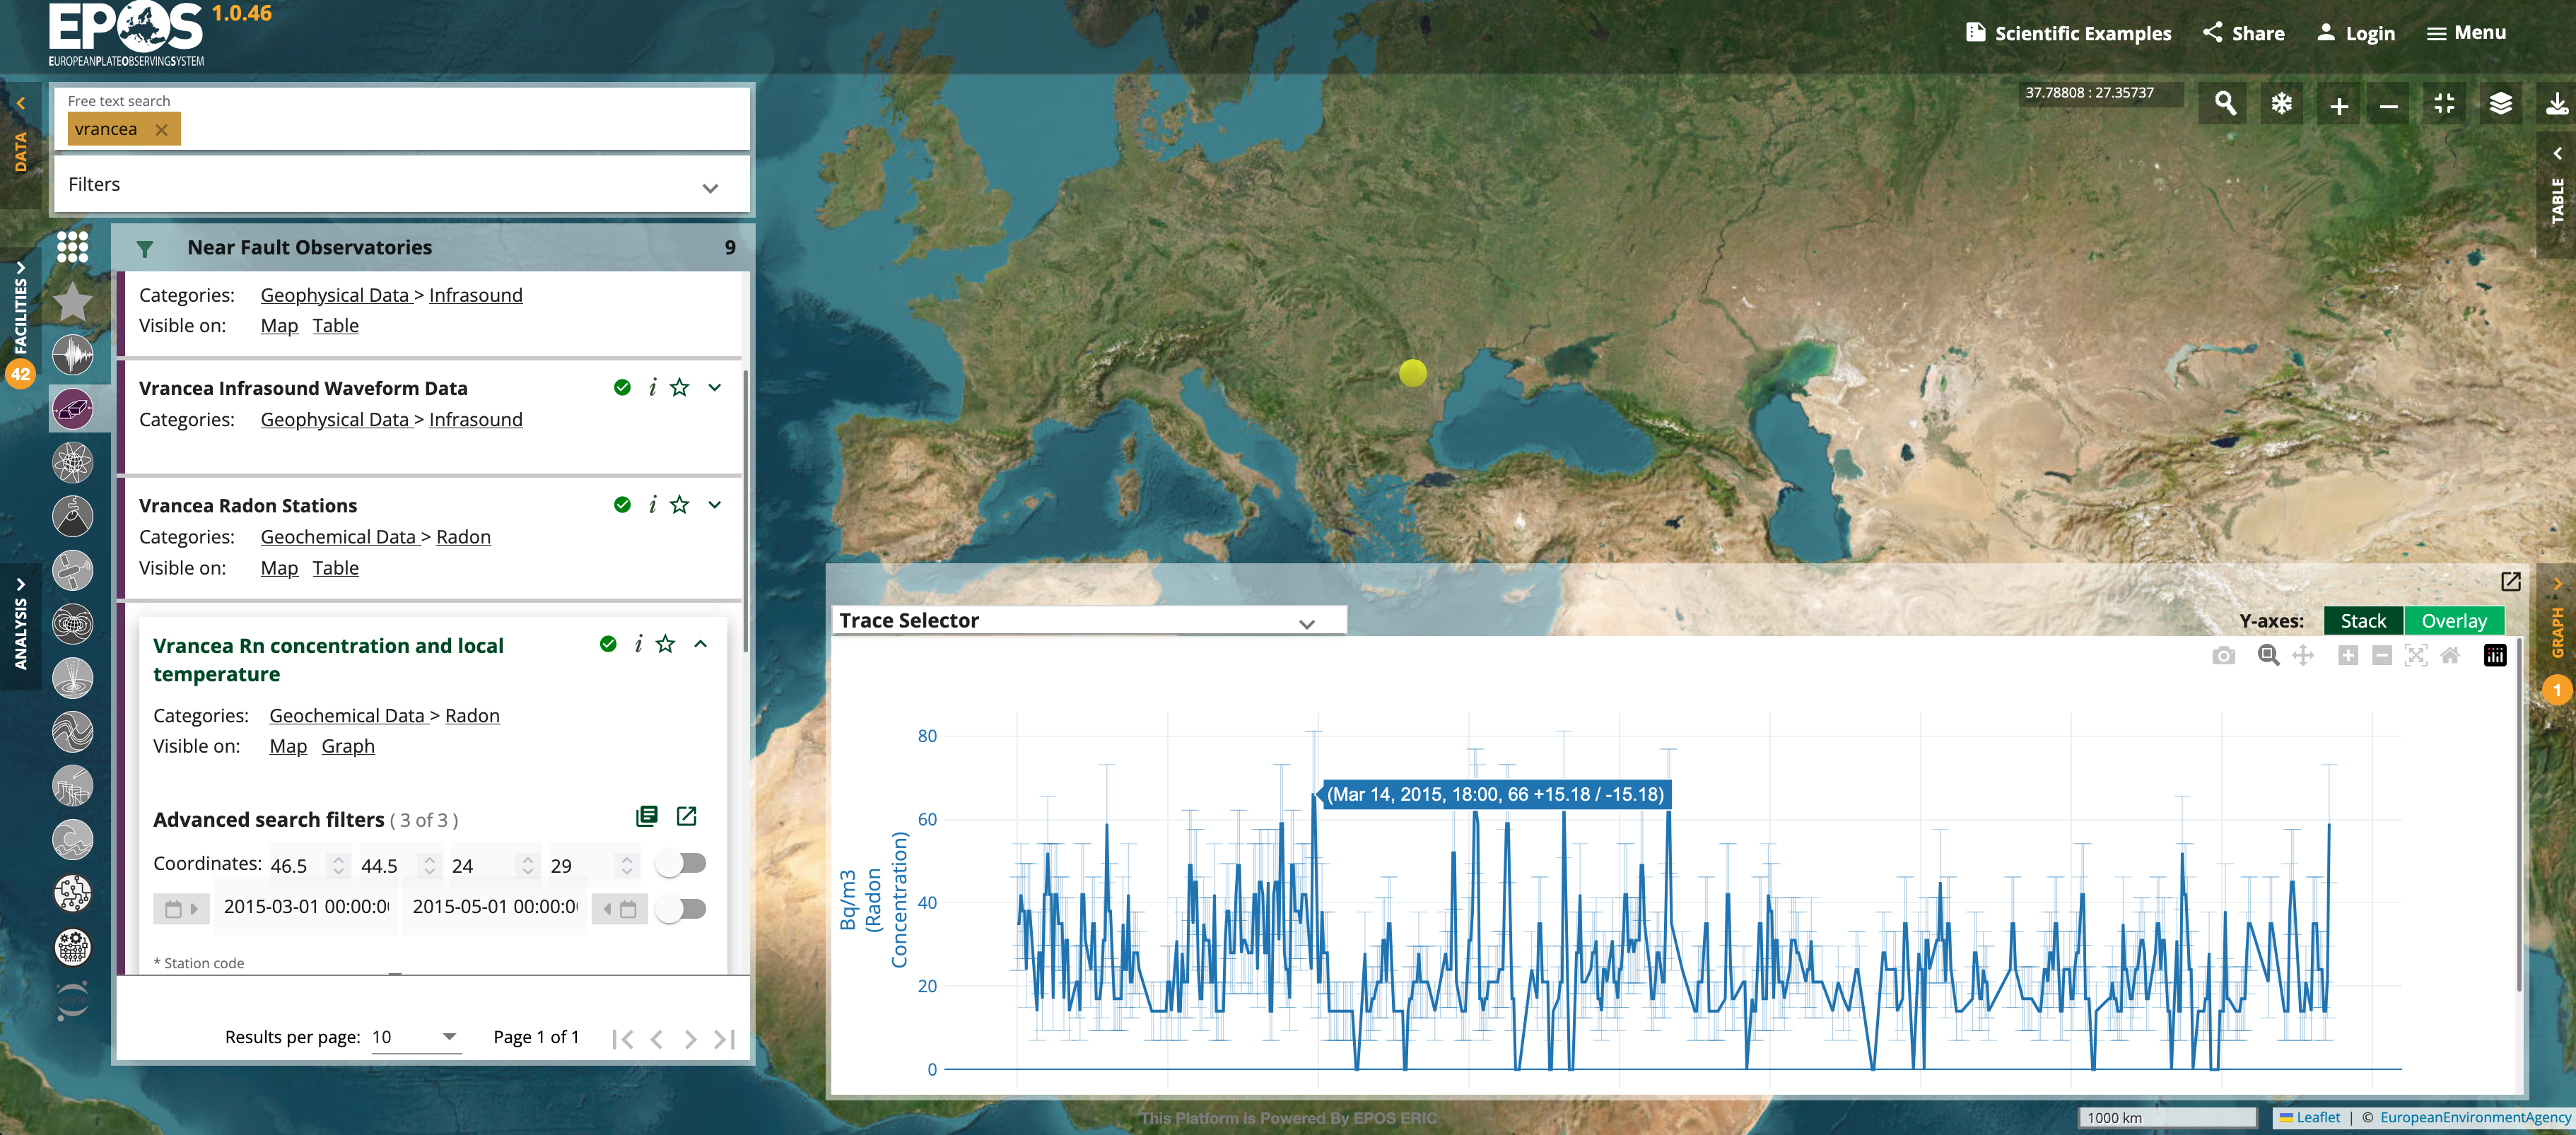
Error bars are a crucial component in scientific data visualization, as they graphically represent the variability or uncertainty of reported measurements. The EPOS GUI supports displaying time series with error bars, significantly enhancing the visualization of data uncertainties and aiding in more robust data interpretation:
Usage
To correctly display error bars for a time series, the CoverageJSON payload must follow a specific format:
-
Include Three Parameters: Your CoverageJSON must define at least three parameters:
- Actual Value: The main time series data.
- Error Minimum: The lower bound of the error.
- Error Maximum: The upper bound of the error.
-
Define Error Parameters:
- For each error parameter, set the
observedProperty.idexactly to"error_min"for the error minimum or"error_max"for the error maximum. - This exact
idis crucial for the GUI to recognize the parameter as an error bound. - All the parameters that have an
idthat is either"error_minor"error_max"will not be shown by the GUI as individual time series.
- For each error parameter, set the
-
Create a
ParameterGroup:- Add a new parameter of type
"ParameterGroup"to theparametersobject. - This group will link the actual value with its associated error parameters.
- In the
membersarray, list the keys (names) of the parameters representing the actual value and its error bounds. - The
ParameterGroupmust have exactly three items in themembersarray: the actual value, the error minimum, and the error maximum. The order of this array is not important.
- Add a new parameter of type
-
Provide Ranges for Each Parameter:
- For every parameter that is not a
ParameterGroup, include a correspondingrangeobject inside therangesobject. - The key for each
rangemust match the parameter key in theparametersobject. - There is no
rangeobject for theParameterGroup.
- For every parameter that is not a
By following this structure, the EPOS GUI will parse the CoverageJSON payload and display the time series with error bars derived from the specified error parameters. The error parameters themselves will not be displayed separately but will be used to render the error bars in the visualization.
Example
Below is an example illustrating the correct structure:
{
  ...

  "parameters": {
    "vpvs_value": {
      "description": {
        "en": "Vp/Vs time series value"
      },
      "observedProperty": {
        "id": "vpvs_value",
        "label": {
          "en": "Vp/Vs Value"
        }
      },
      "type": "Parameter",
      "unit": {
        "label": {
          "en": "Vp/Vs"
        },
        "symbol": {
          "type": "Ratio",
          "value": "Ratio"
        }
      }
    },
    "vpvs_error_min": {
      "description": {
        "en": "Minimum error for Vp/Vs"
      },
      "observedProperty": {
        "id": "error_min",  // Must be exactly "error_min"
        "label": {
          "en": "Minimum Error"
        }
      },
      "type": "Parameter",
      "unit": {
        "label": {
          "en": "Vp/Vs"
        },
        "symbol": {
          "type": "Ratio",
          "value": "Ratio"
        }
      }
    },
    "vpvs_error_max": {
      "description": {
        "en": "Maximum error for Vp/Vs"
      },
      "observedProperty": {
        "id": "error_max",  // Must be exactly "error_max"
        "label": {
          "en": "Maximum Error"
        }
      },
      "type": "Parameter",
      "unit": {
        "label": {
          "en": "Vp/Vs"
        },
        "symbol": {
          "type": "Ratio",
          "value": "Ratio"
        }
      }
    },
    "vpvs_group": {
      "description": {
        "en": "Vp/Vs value with errors"
      },
      "members": [
        "vpvs_value",      // Actual time series
        "vpvs_error_min",  // Error minimum
        "vpvs_error_max"   // Error maximum
      ],
      "observedProperty": {
        "id": "vpvs_group",
        "label": {
          "en": "Vp/Vs with Errors"
        }
      },
      "type": "ParameterGroup"  // Must specify "ParameterGroup"
    }
  },
  "ranges": {
    "vpvs_value": {
        ...
    },
    "vpvs_error_min": {
        ...
    },
    "vpvs_error_max": {
        ...
    }
    // No range for "vpvs_group" since it's a ParameterGroup
  }
}
Explanation of the Example:
-
Actual Value Parameter (
vpvs_value):- Represents the main time series data.
- Defined with a unique
observedProperty.id(e.g.,"vpvs_value"). The specific value of thisidis flexible, as its role is defined by its inclusion in theParameterGroup.
-
Error Parameters (
vpvs_error_minandvpvs_error_max):- Both have
observedProperty.idset exactly to"error_min"and"error_max", respectively. - This identifies them as error bounds for the GUI.
- Their connection to the actual value is established through the
ParameterGroup, not through theirobservedProperty.idor their names.
- Both have
-
ParameterGroup (
vpvs_group):- Groups the actual value and its error parameters.
- The
membersarray includes the keys of the parameters:"vpvs_value","vpvs_error_min", and"vpvs_error_max". - The order of the members does not matter, but there must be exactly three members corresponding to the actual value, error minimum, and error maximum.
-
Ranges:
- Each parameter (excluding the
ParameterGroup) has a correspondingrangein therangesobject. - The keys in the
rangesobject match the parameter keys in theparametersobject. - Each
rangecontains the data values for that parameter following the standard CoverageJSON structure.
- Each parameter (excluding the
- Consistency of Keys: Ensure that the keys used in the
parametersobject match those in therangesobject and themembersarray of theParameterGroup. - No Direct Linking in Error Parameters: The error parameters (
error_min,error_max) do not directly reference the actual value parameter. Their association with the actual value is established solely through their inclusion in theParameterGroup. - Single Time Series with Errors: The GUI will display the
ParameterGroupas a single time series with error bars. The error parameters will not be displayed separately.
Summary
To have the EPOS GUI display error bars for a time series, follow these key steps:
- Define the actual value and its error bounds as separate parameters.
- Set the
observedProperty.idof error parameters exactly to"error_min"or"error_max". - Create a
ParameterGroupthat includes the actual value and error parameters. - Ensure each parameter (except the
ParameterGroup) has a correspondingrange.