Platform Usage Guides
The EPOS Platform helps end users discover, visualize, and access geospatial data services from one catalogue interface. These guides walk through common ways of using the Platform with the Santorini area as a consistent example, so you can learn the main interface patterns for exploring services, using prepared Scientific Examples, and moving into notebook-based analysis.
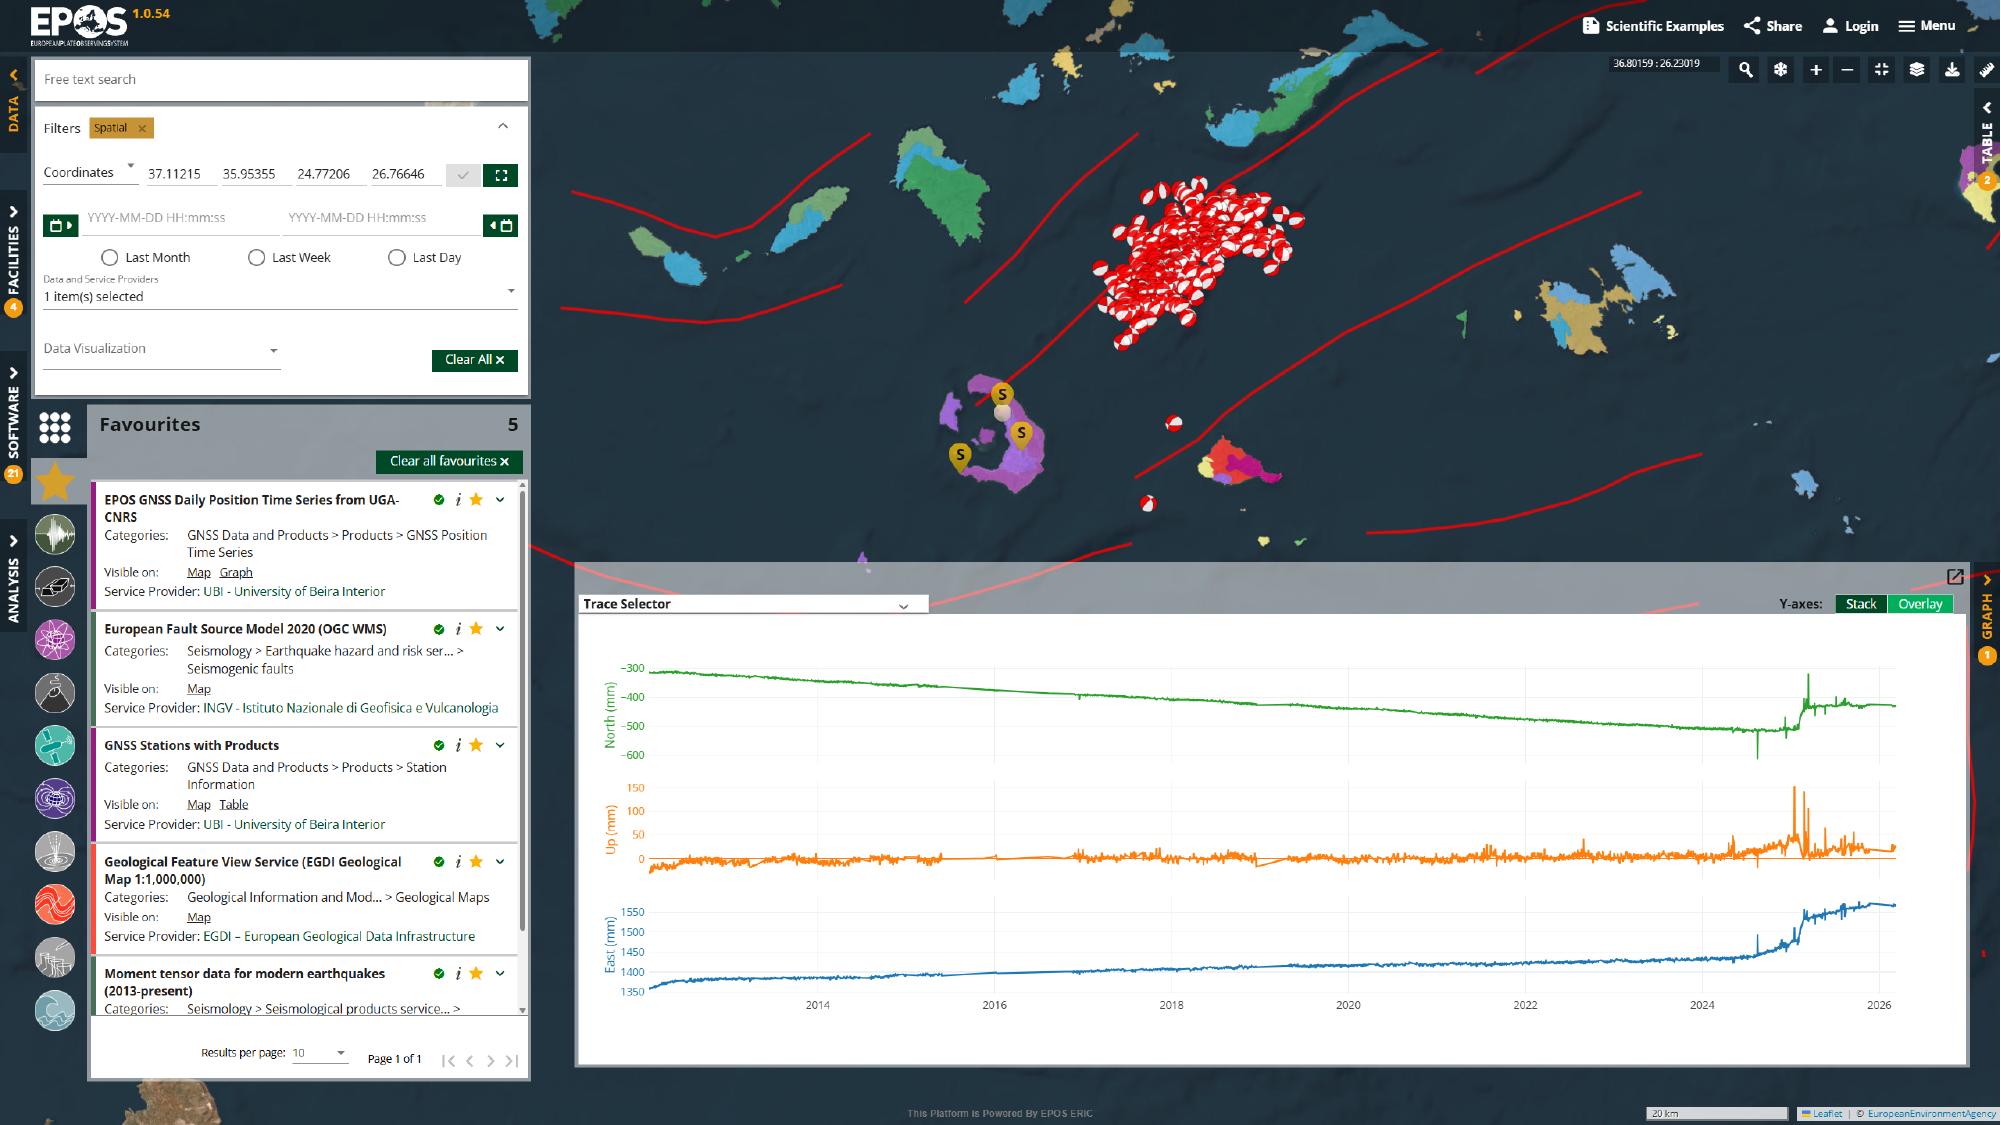
No matter which path you choose, the same core features appear throughout the Platform:
- Place search to move quickly to an area of interest
- Spatial filters to reduce the catalogue before opening services
- Favorites to build a reusable service set
- Map, table, graph, and details views to inspect the same service in different ways
- Share links to preserve and send the current workspace state to someone else
Use free-text search when you want to match keywords, service names, or service descriptions. You can also browse the available services directly from the catalogue and then inspect them on the map, in tables, in graphs, or in the service details.
Start here
If you are new to the Platform, start with How to explore the Platform interface. It introduces the core approach used across the rest of this section: search for an area, narrow the catalogue, open useful services, compare views, save the result, and use Scientific Examples as prepared starting points when they are available.
Guides in this section
How to explore the Platform interface
Use How to explore the Platform interface to learn the main interactive approach: search for an area, apply filters, open services, compare views, share the result, and use Scientific Examples as prepared starting points.
How to use Jupyter Notebooks in the Virtual Research Environment
Use How to use Jupyter Notebooks in the Virtual Research Environment when you want to move from the standard Platform views into notebook-based analysis in a VRE.